

The digital attack surface, all the hardware and software that connect to your organization’s network, is expanding at a rapid rate. But while there are constant reminders, including from ourselves, on practical ways to avoid a cyberattack, the sheer volume means successful attacks are increasing. That’s why the ability to detect, stop and fix an in-progress attack is critical.
In this article, we’ll look at just one of the tools we use and run through some of the most common reports and filters we recommend to keep your network safe.
The data is everywhere
The data you need to spot an attack or even strange behavior on your network before an attack is usually available in abundance from your firewalls, but putting it all together in a way that makes it easy to spot and deal with an issue usually isn’t.
We use FortiGate firewalls extensively with clients for various reasons; their excellent reputation and value, high performance and security, and innovative integrations and features, but also because of the real-time network visibility and response their FortiAnalyzer service gives us. In essence, it’s a powerful log management, analytics and reporting platform that lets you identify, manage and respond to threats, all in one place.

This Wisconsin manufacturer needed to modernize its IT infrastructure to support rapid business growth.
Discover what they didDepending on how mature your security operations are, the FortiAnalyzer offers a comprehensive set of tools to manage risks. But, if you don’t have dedicated in-house security professionals who can pour over the insane 800+ available reports or respond to alerts, a more straightforward option is to get visibility of the most common reports, filters and attack areas through a managed security service.
Essential reports to keep your network safe
Top Threats dashboard
FortiAnalyzer contains many dynamic dashboards to show you threat information over a configurable time period. The reporting time can be set to whatever interval you deem appropriate, and results quickly reviewed to act upon these threats.
One thing to note is that all the data you get from FortiAnalyzer is live data. It’s not historical reporting. In terms of data retention, live analytics are kept for 60 days, and then all logs are archived for 180 days.
Below is the ‘Top Threats’ dashboard, showing you the current security risks in our example environment.
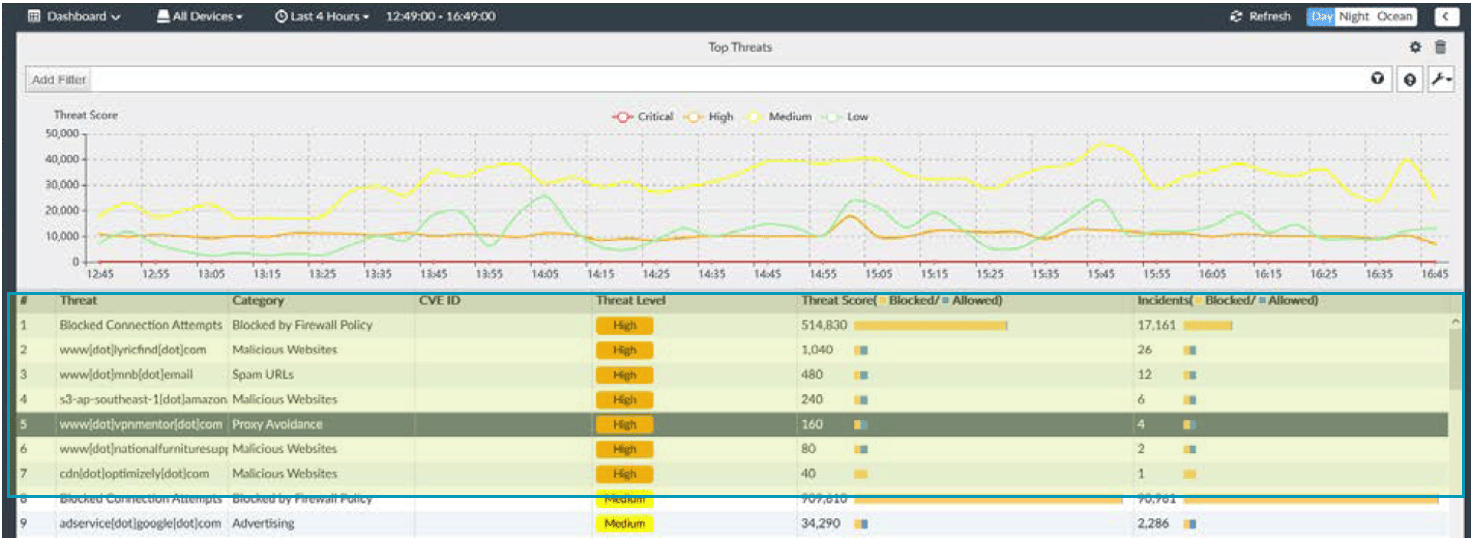
Review High and Critical severity threats to ensure they’re being blocked appropriately.
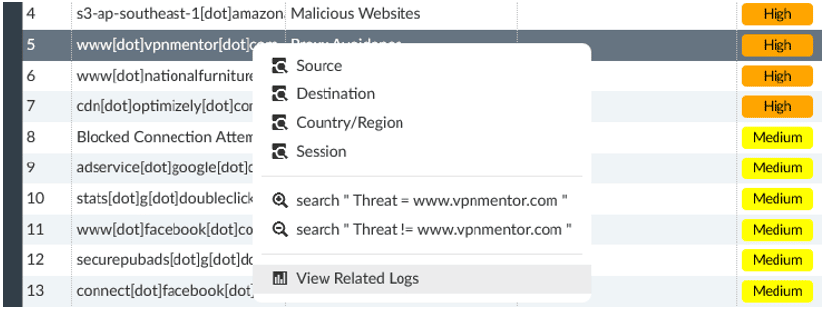
To find detail on any event, right-click on the threat and select ‘View Related Logs’.
Any information logged about the threat, including the source user, application, and time will be shown. Note: User tracking requires the FSSO agent and an Active Directory environment or FortiAuthenticator. Device identification can also provide some detail in certain use cases.
Click on listed security events to see more detail.
With SSL Decryption enabled, it may even be possible to see the exact URLs visited to determine the nature of the activity. This can differentiate accidental access to a site from intentional attempts.

Note that the exact URL is displayed.
Filters and antivirus log
FortiAnalyzer filters allow you to refine log events to review actions taken by the firewall in real-time or historical views. This can help you check the efficiency of the firewall in stopping threats, gather metrics to drive business decisions, or follow up with users as necessary. Here is an example of using filters to only show blocked antivirus actions.
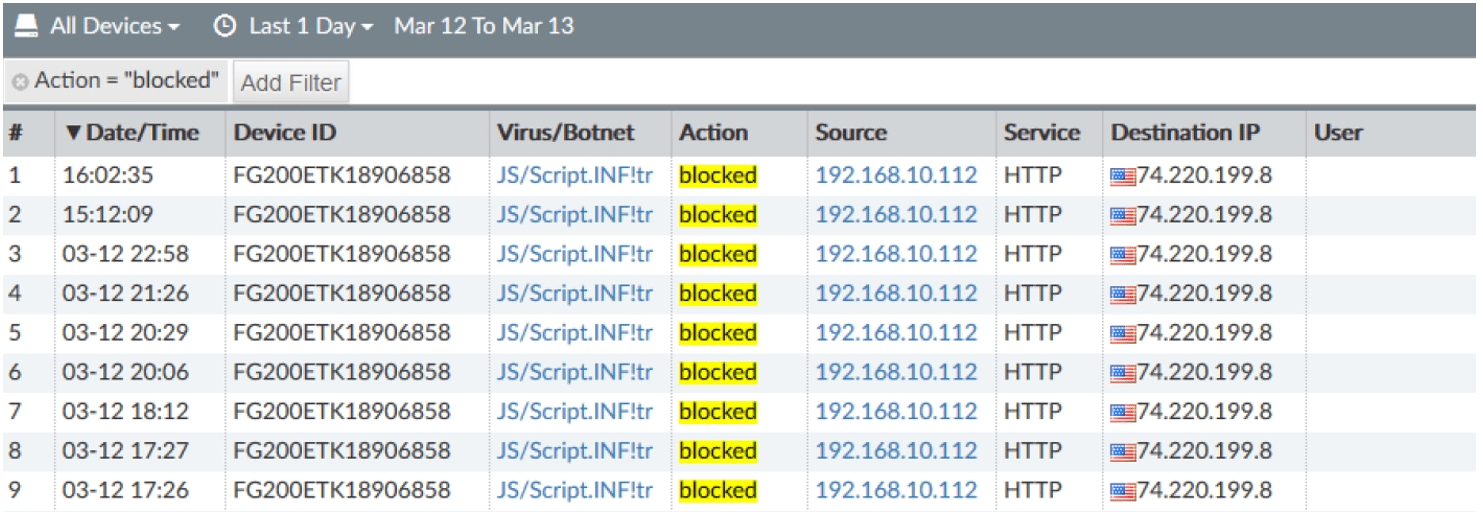
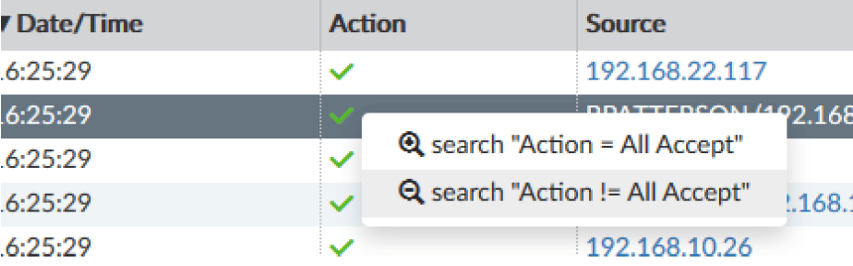
Filters can be created manually or by right-clicking any field and selecting whether to include or exclude the values from the results. Filtered results can then be saved as custom views for easier access if you frequently review the same data. The output of these views can also be turned into a chart for inclusion in a custom report if needed.
Blocked web pages
Top 20 Blocked Web Categories
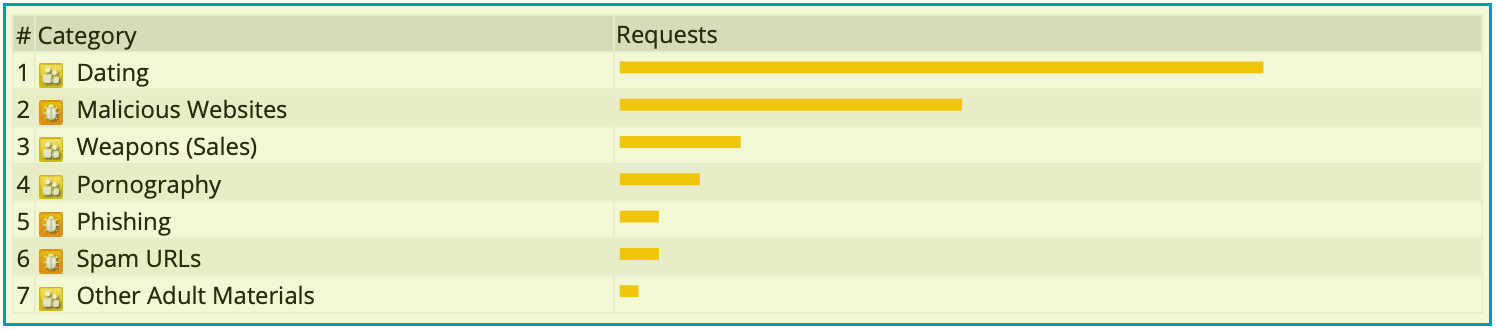
Reviewing top categories can tell you if your web threats are mostly policy or security risks.
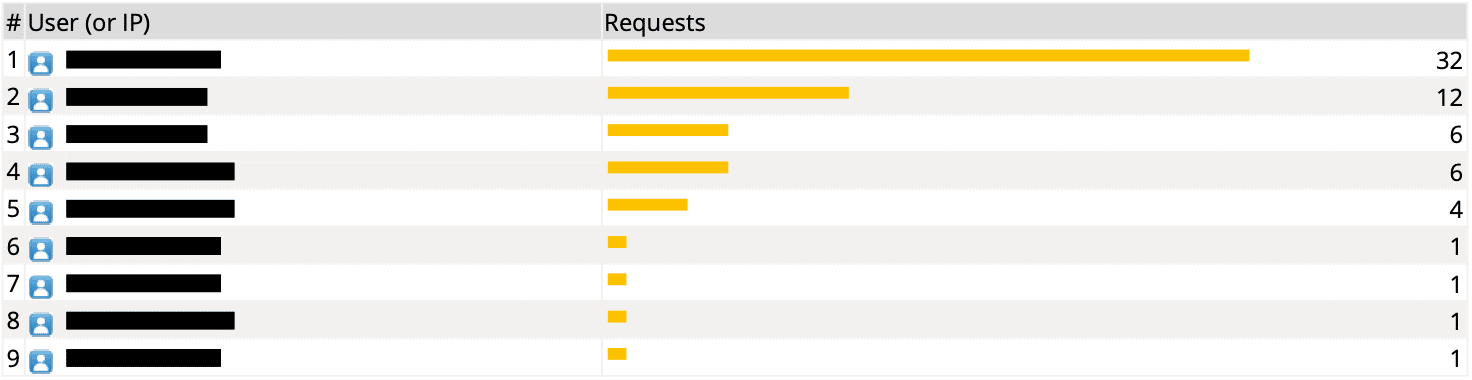
Top Web Users by Blocked Requests
Blocked Web Traffic Chart
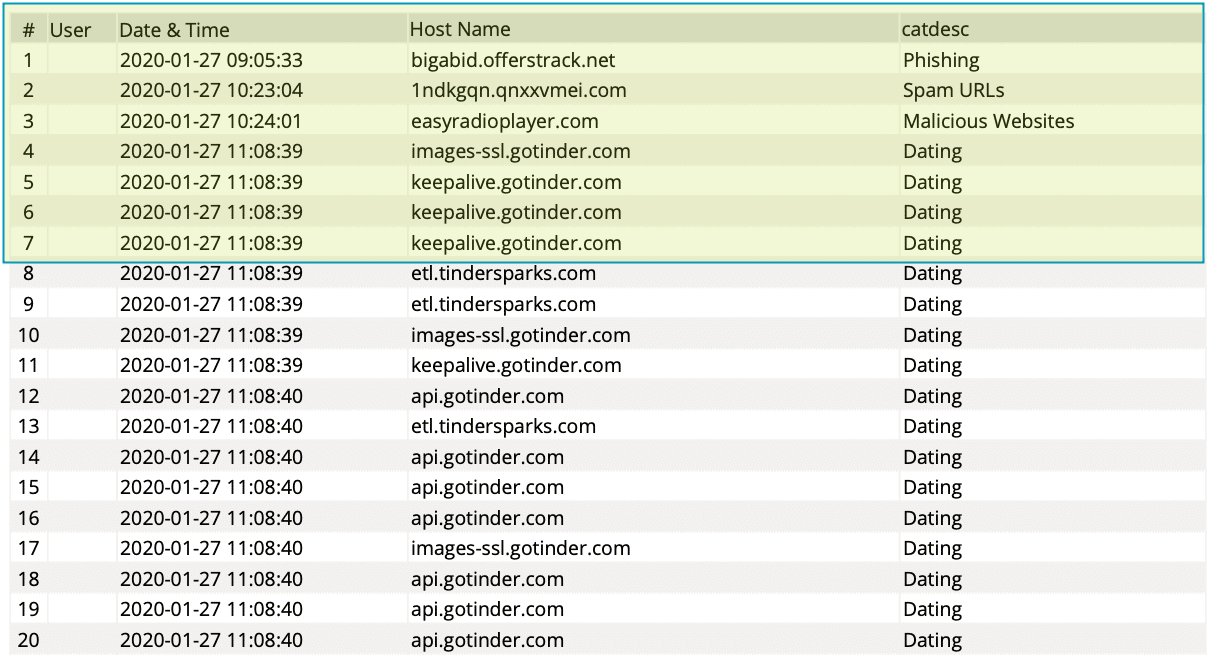
The date/time, website, and category are displayed. User authentication must be configured in firewall rules to track account names.
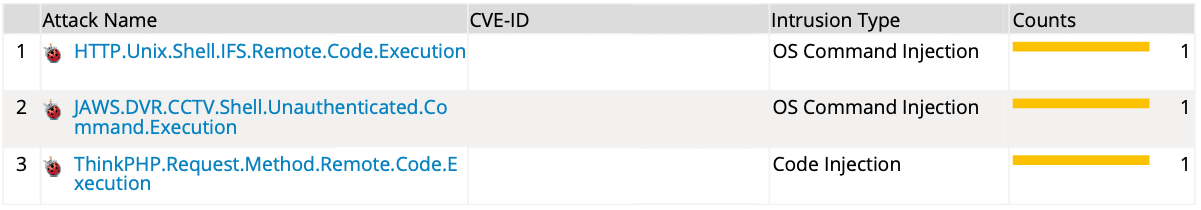
Intrusions detected
Critical Severity Intrusions
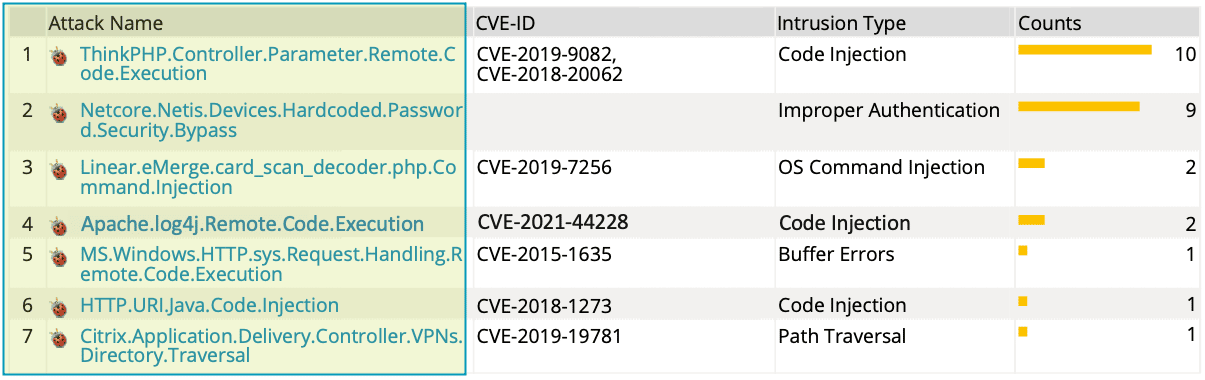
These are specific attacks stopped by the Fortigate. Review these to determine if your systems would be vulnerable and patch or remediate as needed. While blocking attacks is a good step, removing the vulnerability targeted is even better.
High Severity Intrusions
Medium Severity Intrusions

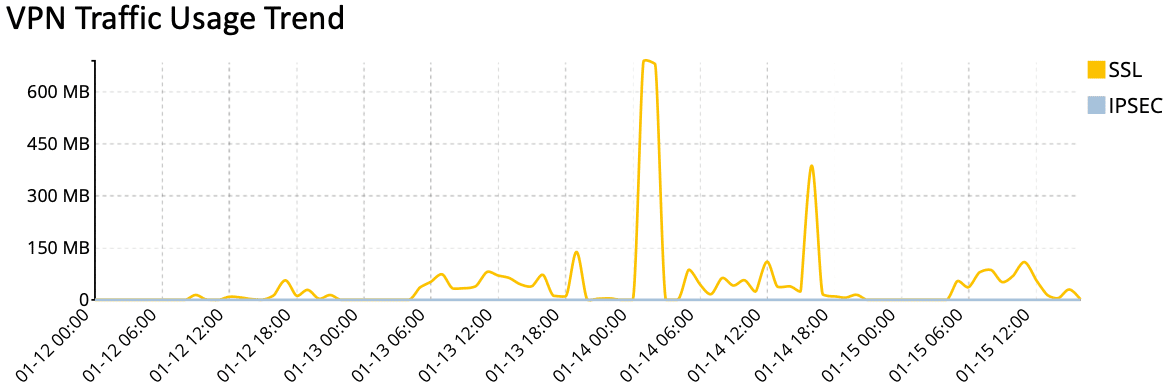
VPN activity
VPN Traffic Usage Trend
VPN User Logins
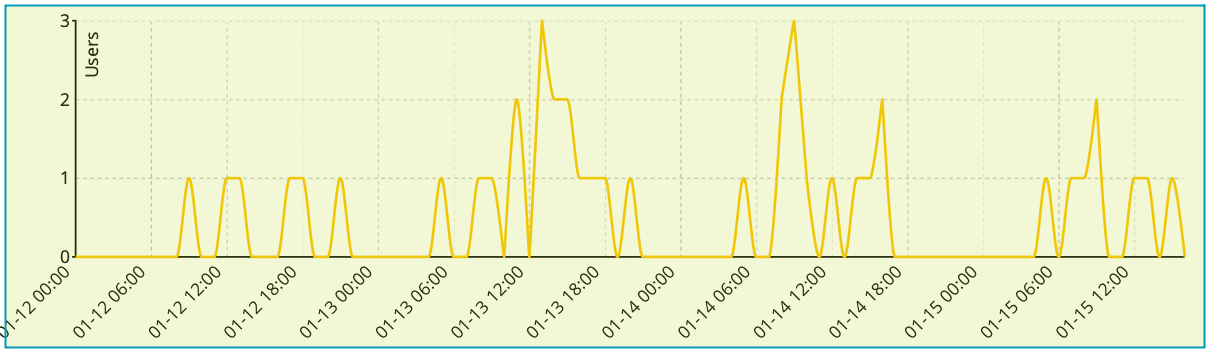
Watch concurrent VPN user counts to determine if Internet bandwidth may need to be increased.
Authenticated Logins
Failed Login Attempts

These are just a few examples of the reports we recommend to help you deal with cyber threats and ongoing attacks.
A managed security operations service
As I mentioned earlier, a managed security service that monitors your network AND deals with the threats means you can stay focused on your business and not the data.
Fortunately, that’s a service we provide. It includes:
Alerting
- Receive immediate notification of system events, blocked traffic, or attacks so you can respond appropriately.
- Detect ‘Shadow IT’ activity such as; unauthorized cloud service usage, off-site data storage, or unapproved remote access connections.
Logging
- Traffic entering/leaving your network for troubleshooting, usage reporting, or incident response.
- Individual users’ actions for later analysis/review in case of a security incident.
Reporting
- Daily or weekly emails about your organization’s top threats, VPN usage, web browsing, or any other logged data.
- Automatically apply UTM actions and policies against threats and attackers to limit lateral compromise.
Monitoring
- Internet Usage: information including web browsing and application usage.
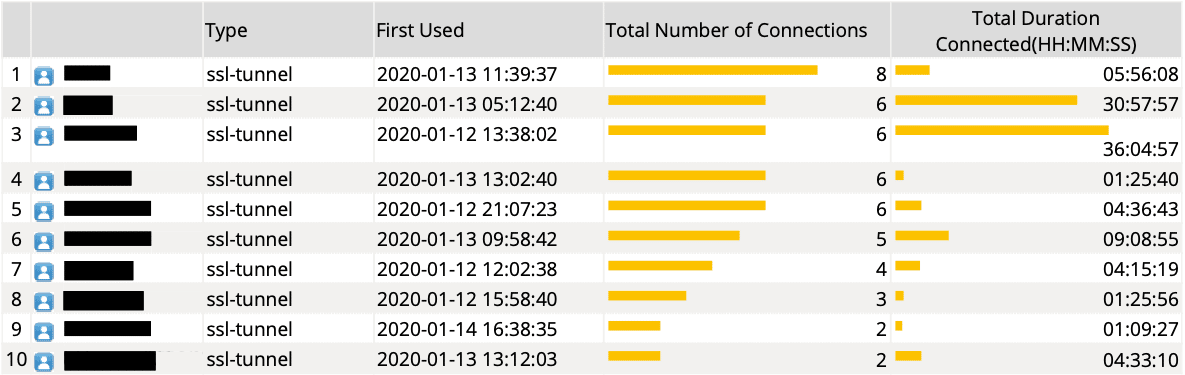
- VPN usage: see who’s connecting remotely, when, and how long.
Troubleshooting
- Determine the root cause of issues with dashboards, powerful filtering queries, and traffic logs.
If you’d like help improving your security operations or want to know more about our managed service, then please get in touch.


