

In the first part of this article, we discussed the reasoning behind the rise in popularity of client-side metrics, application analysis tools and quantification of the user experience. User expectations are changing, and the focus of monitoring should be equally divided between client and server, rather than weighted towards the infrastructure end.
Before you get to the actual stage of looking at the various tools out there, often the biggest challenge is getting buy-in from your management or customer into the actual requirement for these metrics and analytics. The attitude that “we have Tool X, and Tool X can do everything we need” is often incumbent. But traditional tools are, as we have pointed out, focused on reactive alerting on infrastructure and configuration components. This misses the point of the users themselves as the most important part of any business. Servers, storage and network can be green in monitoring tools, yet the users may be struggling to get their work done and impacting productivity. Conversely, your servers could be red-lining and yet the user experience could be excellent. Focusing on RAG (red-amber-green) alerting around specific infrastructure components is not the way to actually gauge the user experience, and the users’ level of satisfaction and productivity.
It’s not easy to try and convince management to change this mindset and spread their focus more evenly across the environment, but it needs to be done. Focusing on specific pain points and proactively assessing the user experience can help them with accepting this change:
- How often do users experience application crashes?
- How often does application responsiveness dip below a pre-defined level of acceptability?
- How long does it take them to log on, to print, to log off?
- And most importantly, how much are these issues costing them, in terms of time, productivity, and user frustration?
Running a good PoC can also help with this mindset change, showcasing solution capabilities and showing the business how they can benefit from such deep analysis. Being able to identify the state of an endpoint at the exact time an issue occurred – even if it was reported long after the event – can make root cause analysis vastly more easy and more accurate. Proactive monitoring can be done, allowing support teams to identify and fix issues without users even picking up the phone. Projects can benefit from granular analytics that allow objective measurement of infrastructure performance and the fulfilment of specific success criteria.

This Wisconsin manufacturer needed to modernize its IT infrastructure to support rapid business growth.
Discover what they didWhat tools can you use for application analysis and monitoring
There are many tools out there, but some of the ones I have had particularly good experiences with are detailed below.
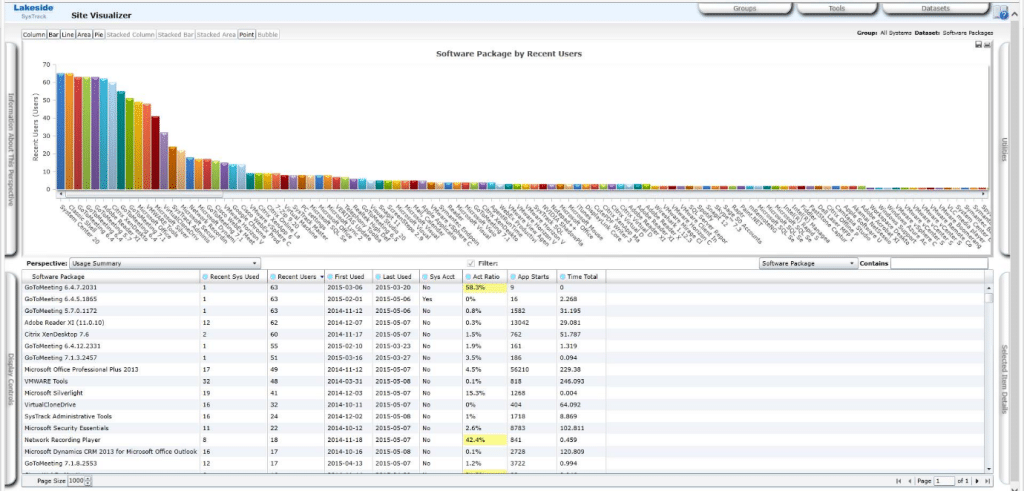
Lakeside Systrack
If it’s masses of data you want, you probably need look no further than Systrack. An agent-based solution, it started life as what originally became Citrix Resource Manager, but is now an incredibly detailed monitoring solution pulling in more than 10,000 metrics from each endpoint. It seems daunting and complex at first, but once you’re in, you will find you have possibly more data than you could ever need, and are capable of manipulating and presenting it in just about any way you could want to imagine. However, it isn’t the cheapest solution around, but it’s very much a case of you get what you pay for.
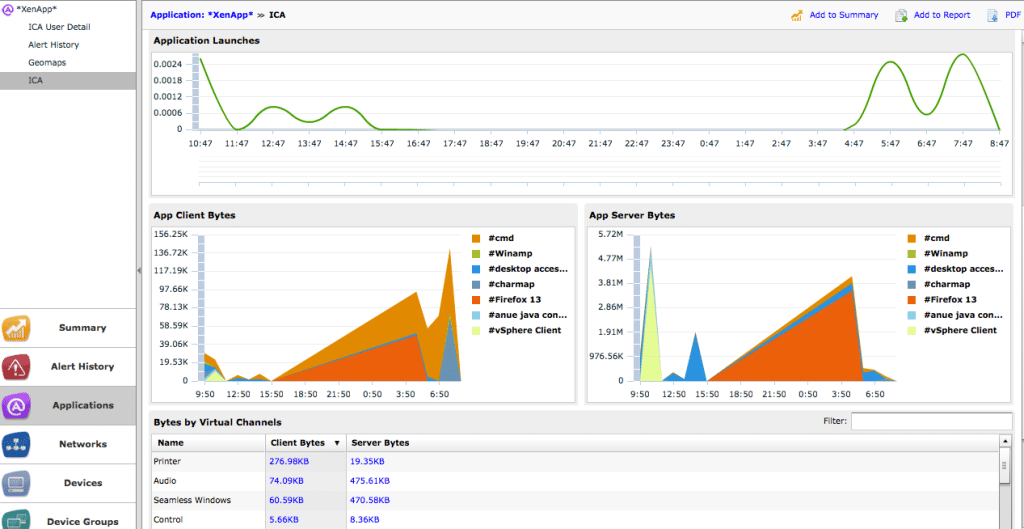
ExtraHop
ExtraHop is interesting mainly because it is agentless, instead relying on “wire data”, using a port tap or mirror to watch transactions occurring on the network and extrapolate analytics data from it. It can offer a wide range of data and reports, allowing you to view performance at the various tiers and see how service delivery is impacted. The “wire data” approach is also clever, allowing you to still view transactions and the associated data even if logging on the endpoint has failed or been stopped.
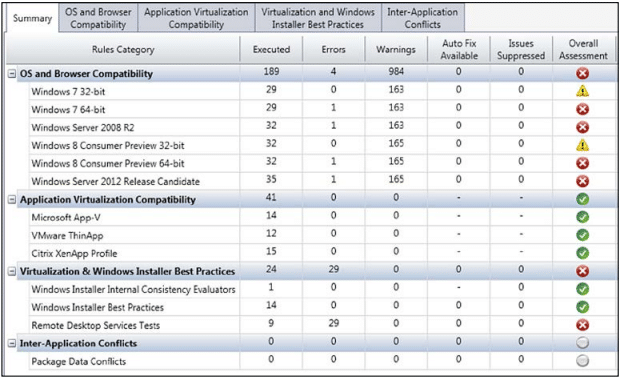
Flexera AdminStudio virtual desktop assessment
Flexera’s product ships as part of a wider suite (AdminStudio) and, as you can probably tell from the title, is mainly intended for use as an assessment tool for VDI capability. However, it does do a lot more than just that, allowing lots of visibility into application compatibility, and assessment of mobile applications is a very interesting capability that isn’t present in any of the other solutions mentioned herein. However, it does seem much more concerned with application deployment rather than understanding application behaviour, so the focus of the data and analysis is unfortunately somewhat limited.
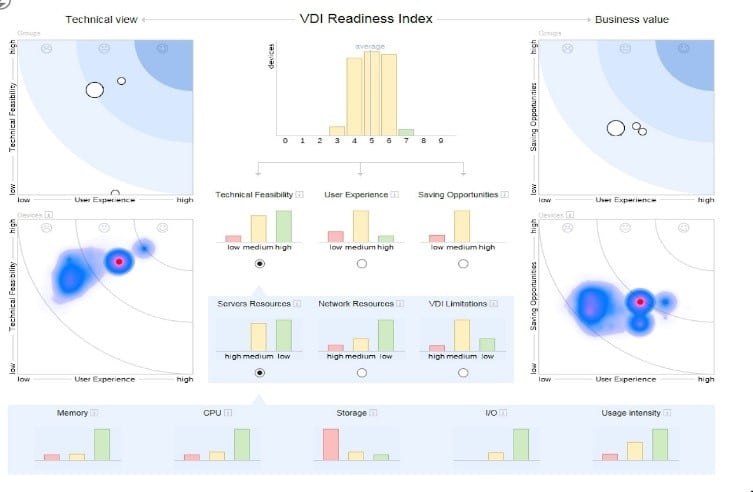
Nexthink
Nexthink is a fairly new kid on the block, bringing some cool AI patents and some excellent visualizations to the table. It has a lot of monitors (750, although that does sound rather paltry next to Systrack, it does still get a lot of data), and is very focused on proactive monitoring of experience, security and reliability. Some of the visual elements are very slick (the graphical representations of load balancer traffic being a particular favorite of mine), and it can actually do some basic licensing compliance reporting, something none of the other solutions can manage at present. However, one of the disappointing aspects of it is that it doesn’t have a trial version available (although you can commission a “baseline report”, for a one-off cost).
Summary
Unless you’re the world’s greatest scripter, then you will need a third-party tool to achieve reliable and detailed client-side monitoring/application analysis. The tools mentioned above all have their respective pros and cons. There are other tools in the space that are easier to get up and running quickly if you need “instant” data (think AppSense Insight, or LiquidWare Labs Stratusphere), but they don’t have the level of detail offered by some of the solutions mentioned previously.
If the environment necessitates agentless deployment, then ExtraHop is probably your only viable choice. If you’re comfortable with agent-based, then Systrack or Nexthink offer huge insights into the environment along with some excellent reporting and realtime diagnosis tools. Systrack has the edge in terms of scope, but it is quite expensive, although Nexthink falls down slightly due to the lack of a trial version.
Whichever solution you choose, the hard facts of the matter are that client-side monitoring, user experience and application analysis are here to stay. Companies that ignore them and focus purely on the backend infrastructure are going to frustrate and alienate the most important people in the business – the people on the frontlines, doing the hard work and bringing in the revenue streams. But companies that offer their employees a slick, responsive and resilient user experience are going to have workers that are more satisfied, more productive and less likely to leave – a set of benefits that every enterprise should be striving to offer.


